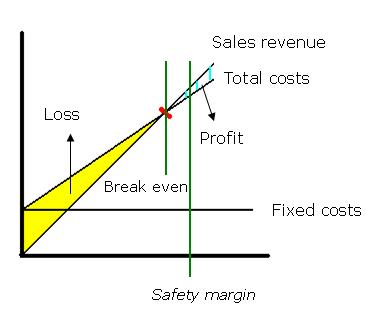
This is the Break Even chart which shows a firm's total revenue and costs at all possible levels of output/demand; it means no profit and no loss. It consists of 3 lines,
- Fixed costs
- Total costs
- Sales revenue (Total revenue)
The Break Even chart doensn't consider external environment.
Also there's Safety Margin, which indicates The difference between current output and break even.
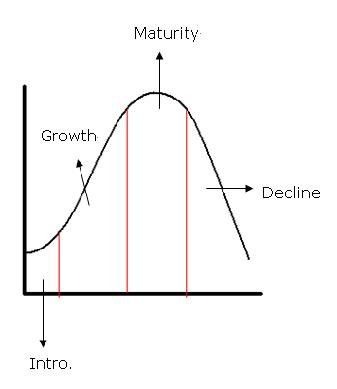
This is a diagram showing the birth, growth, maturity and decline of a product; it called the Product Life Cycle.
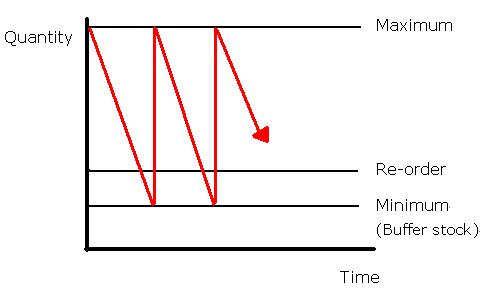
Stock Control chart shows the quantity of stock considered the minimum before more need be ordered from the supplier; it is depending on the appropriate reorder level of a firm.